Restaurant Food Waste Audits in Asia: A Practical Guide to Measuring What Your Kitchen Throws Away
A restaurant can know exactly how much it spent on ingredients last month and still have very little idea how much of that food was actually wasted.
The problem is not usually a complete absence of data. Purchasing systems record what entered the business. Point-of-sale systems record what customers bought. Inventory counts show what remains. What disappears between those points can be surprisingly difficult to explain.
That missing information matters. The United Nations Environment Programme estimated that food service accounted for 28% of the 1.05 billion tonnes of food waste generated globally at retail, food-service and household level in 2022. Across Asia, the issue is increasingly becoming operational as well as environmental. Singapore, for example, reported 790,000 tonnes of food waste in 2025 and has introduced food-waste segregation and reporting requirements for specified large commercial and industrial premises.
Restaurants do not need sophisticated sustainability software to start understanding their contribution. They need a baseline.
A Food Waste Audit Is an Operating Tool, Not a Bin Inspection
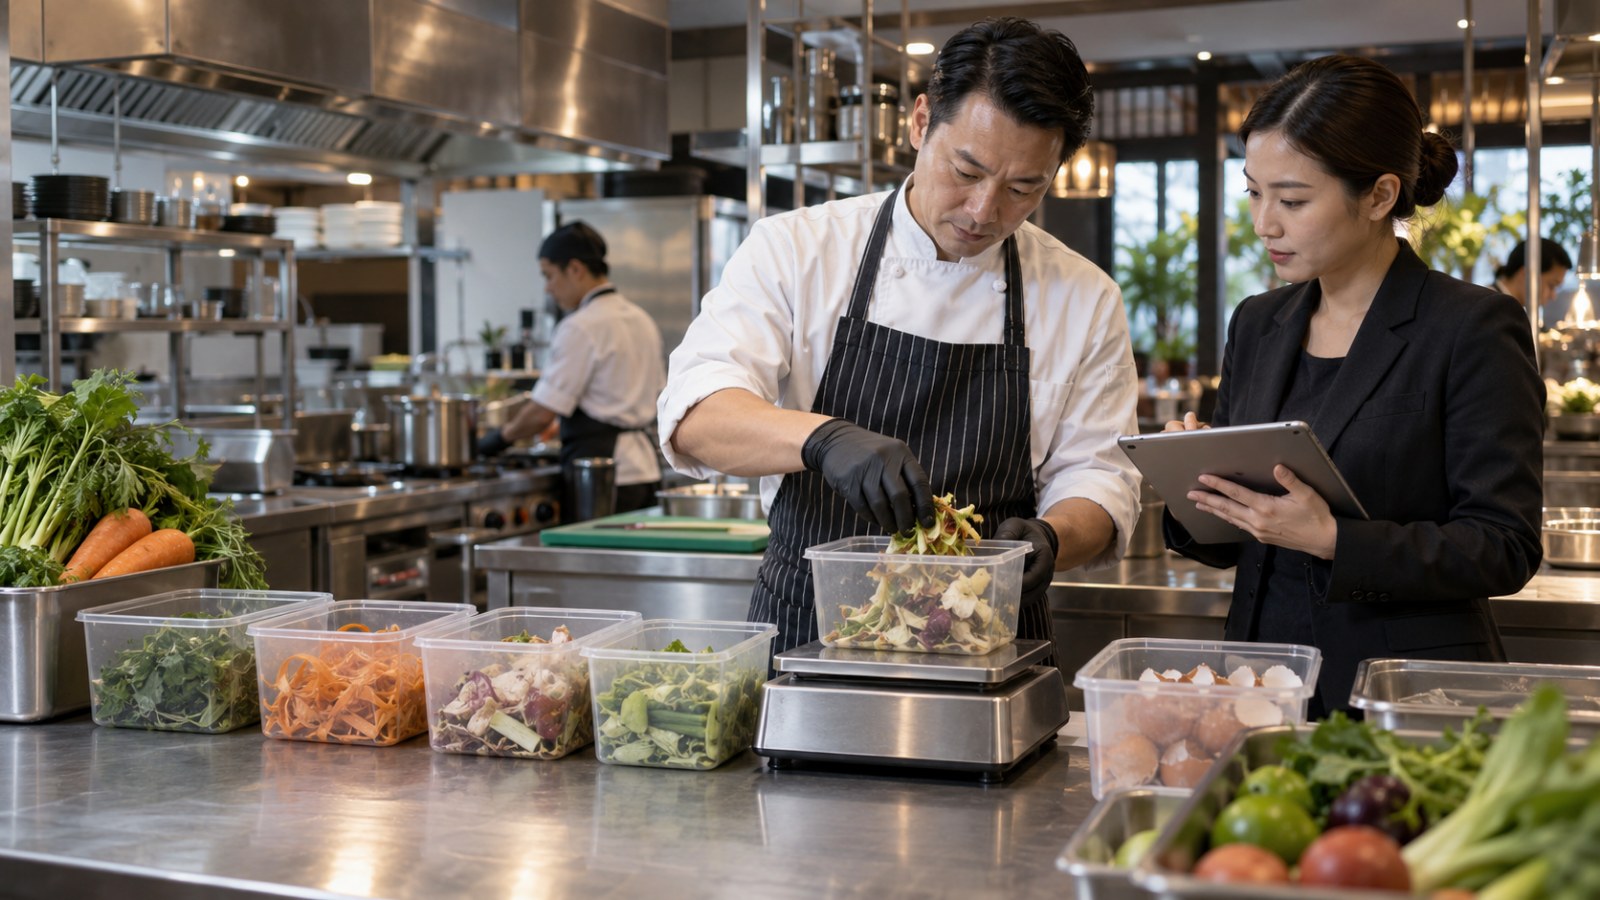
A restaurant food waste audit systematically records what food is discarded, how much is discarded, where it originated and why it became waste.
The last question is the most important.
Knowing that a restaurant discarded 42 kilograms of food tells management very little. Knowing that 18 kilograms came from unsold batch production, 11 kilograms from customer plates, eight kilograms from expired inventory and five kilograms from normal preparation trim creates four different management problems.
Each requires a different response.
| Waste Category | Typical Cause | Likely Management Response |
|---|---|---|
| Preparation waste | Excess trimming, poor yield or inconsistent preparation | Review specifications, knife skills, recipes and ingredient utilisation |
| Spoilage | Over-ordering, poor rotation or weak forecasting | Change purchasing quantities, storage controls and inventory routines |
| Overproduction | Too much food prepared relative to actual demand | Improve forecasting, batch size and production timing |
| Plate waste | Portions, menu design, quality or customer preference | Review portion size, recipes and recurring customer behaviour |
| Unavoidable waste | Bones, shells, selected skins or other non-edible material | Consider recovery, treatment or alternative ingredient utilisation where practical |
This is why one general-purpose organic-waste bin is useful for collection but weak for diagnosis. Once every cause has been mixed together, the restaurant knows what it threw away but not which decision created the problem.
Start With Seven Representative Days
For most restaurants, a practical starting point is one representative operating week.
The period should include normal weekday and weekend trading rather than a festival, major promotion, private event or unusually quiet week unless those conditions are specifically what management wants to study.
Set up clearly labelled collection points and explain the process to the kitchen and service teams before measurement begins. The objective is not to find employees to blame. It is to identify where purchasing, preparation, production and service assumptions differ from reality.
Record at Least Six Things
- Date and service period: breakfast, lunch, dinner, banquet or another meaningful operating period.
- Waste category: preparation, spoilage, overproduction, plate waste or unavoidable material.
- Food or ingredient: identify significant items rather than recording everything as “food”.
- Weight: use kilograms or grams consistently throughout the audit.
- Reason: record why the food became waste whenever the cause can be identified.
- Operating context: note unusual demand, weather, events, equipment problems, supplier issues or menu promotions where relevant.
The process should be simple enough that employees will actually follow it during service. An audit containing forty fields that nobody completes accurately is less useful than six fields recorded consistently.
The Restaurant Waste Map
Once the audit is finished, management should analyse waste across two dimensions: where it occurred and why it occurred.
| Stage | Question to Ask | Possible Evidence |
|---|---|---|
| Receiving | Are products arriving damaged, overripe or outside specification? | Receiving logs, rejected deliveries, photographs |
| Storage | Are ingredients expiring before use? | Expiry logs, stock age, inventory records |
| Preparation | Are usable ingredients being removed during trimming? | Prep-waste weights, yield tests, recipe specifications |
| Production | Are batches larger than actual demand? | Production records, POS demand, unsold quantity |
| Service | Are customers regularly returning particular components? | Plate-waste observations, server feedback |
| Closing | Which products are repeatedly discarded at the end of service? | Closing waste logs, leftover batch counts |
This turns waste from an environmental category into an operational trail.
If spoilage dominates, the problem may be purchasing or stock rotation. If overproduction dominates, the forecasting model deserves attention. If one garnish repeatedly returns untouched, the restaurant may be buying, preparing and plating something customers do not value.
Measure Waste Against Activity, Not Just Kilograms
Total kilograms alone can be misleading.
A restaurant serving 2,000 guests will normally generate more food waste than a restaurant serving 300. A restaurant group may even increase total waste while becoming more efficient if customer volume grows substantially faster.
Operators should therefore normalise at least part of the data.
Food Waste Per 100 Covers
Food waste per 100 covers = total food waste in kilograms ÷ covers served × 100
This allows equivalent periods or similar restaurants to be compared more meaningfully.
Avoidable Waste Percentage
Avoidable waste percentage = avoidable food waste ÷ total food waste × 100
Avoidable waste should be defined consistently. Spoiled stock, unnecessary overproduction and edible plate leftovers may qualify, while bones or other genuinely inedible components normally should not.
Estimated Waste Cost
Weight should also be paired with value where practical.
Discarding five kilograms of rice and five kilograms of premium seafood has a very different economic impact. Applying approximate ingredient cost to the major waste categories helps management prioritise the losses that matter financially.
The objective is not accounting precision down to the final cent. It is to stop a large expensive waste stream hiding behind several heavier but cheaper ones.
Separate Waste Reduction From Waste Disposal
Restaurants often begin sustainability programmes by asking where food waste should go after it has been generated.
That question is necessary, but it arrives late.
Singapore’s food-waste hierarchy, for example, prioritises preventing waste before redistribution and treatment. For restaurant operators, the same hierarchy makes commercial sense: food that is never unnecessarily purchased, spoiled or overproduced usually creates greater operating value than food that is efficiently processed after being discarded.
A useful decision sequence is:
- Prevent: Can the waste be avoided through forecasting, purchasing, storage, preparation or portion changes?
- Reuse safely: Can suitable ingredients or components be redirected within approved food-safety procedures?
- Redistribute: Can safe surplus food be donated through an appropriate channel?
- Recover or treat: Can unavoidable material be segregated for suitable processing?
- Dispose: Use disposal only after higher-value options have been considered.
A restaurant should therefore be cautious about purchasing an expensive waste-treatment system before understanding what actually enters it. Treatment capacity addresses waste after generation. An audit may reveal that part of the better investment belongs in forecasting, storage, staff training or portion control instead.
Five Patterns Worth Investigating Immediately
1. The Same Ingredient Is Spoiled Every Week
This usually points toward ordering quantity, pack size, supplier minimums, storage or menu demand. Reduce the order before trying to find a better way to dispose of the ingredient.
2. One Dish Produces Disproportionate Plate Waste
Check portion size and which component returns most frequently. The problem may be serving quantity rather than recipe quality.
3. Waste Rises Sharply Before Closing
Production may not be adjusting quickly enough as the remaining trading window shortens. Smaller late-service batches can sometimes reduce waste without creating stock-outs.
4. Similar Outlets Produce Very Different Waste
This is particularly useful for restaurant groups. Differences can expose inconsistent recipes, prep technique, forecasting or management discipline.
5. Actual Food Cost Is Consistently Above Theoretical Food Cost
Food waste may be part of the variance alongside portion inconsistency, recipe errors, supplier changes, inventory inaccuracies or other losses. A waste audit gives managers another evidence source rather than asking the food-cost percentage to explain everything.
Create a Waste Action Register
An audit creates value only when observations become operating changes.
| Finding | Root-Cause Hypothesis | Action | Measure After Change |
|---|---|---|---|
| High leafy-vegetable spoilage | Order quantity exceeds demand | Reduce order quantity and increase delivery frequency | Spoilage kg per week |
| Large rice leftovers | Standard serving size too large | Trial smaller default portion | Plate-waste grams per cover |
| High buffet closing waste | Late-service production batches too large | Reduce batch size after peak demand | Unsold buffet kg per service |
| High protein trim | Inconsistent preparation specification | Introduce yield standard and training | Usable yield percentage |
Run the change long enough to generate a meaningful comparison, then audit again under similar conditions.
The important discipline is changing one identifiable operating variable and measuring whether the expected waste category actually improves.
Technology Comes After Measurement Discipline
Digital scales, cameras, connected bins and food-waste analytics platforms can provide substantially more detail than manual spreadsheets. They may be particularly useful for hotels, central kitchens and restaurant groups processing high volumes across multiple production areas.
Technology does not remove the requirement to define waste consistently.
If one outlet records an unused prepared dish as overproduction while another records it as spoilage, the dashboard will aggregate incompatible information very efficiently.
Before automating, define:
- the categories being measured;
- the unit of measurement;
- which operating boundaries are included;
- who records the information;
- how corrections are handled;
- how covers and production volume are captured; and
- which management decisions each metric is expected to support.
The quality of the operating definition matters more than the sophistication of the screen displaying it.
When Waste Reduction Becomes a Documented Achievement
Most improvements revealed through a restaurant food waste audit should remain exactly what they are: internal operating improvements.
Reducing kitchen waste by several kilograms, improving food cost or changing portion sizes does not automatically create an exceptional industry achievement.
Occasionally, however, an F&B organisation may develop something substantially more unusual: a large-scale verified reduction programme across many outlets, an exceptional measurable utilisation benchmark, a distinctive circular-food initiative or another achievement that can be precisely defined and independently compared.
At that point, the same measurement discipline used for restaurant operations becomes important for business achievement recognition in Asia.
Asia Record assesses record proposals against measurable and verifiable evidence. An operator researching an Asia Record application, Asia Record certification or how to get an Asia Record should therefore preserve the underlying information before considering publicity.
That means maintaining dated waste logs, operating boundaries, calculation methods, source records, independent evidence where appropriate and consistent definitions over the measurement period.
Businesses considering whether an exceptional culinary or F&B milestone may qualify can review the Asia Record official nomination process. The objective should never be to manufacture a record from an ordinary sustainability programme. Formal record recognition in Asia becomes relevant only when a genuinely exceptional measurable achievement already exists.
If verification is ultimately successful and the organisation becomes an Asia Record holder, the credibility comes from the evidence behind the result rather than from the promotional claim itself.
Measure Before You Promise to Reduce
“Reduce food waste” sounds like a straightforward management target until somebody asks the most important question: reduce what, compared with when?
A restaurant without a baseline cannot distinguish genuine improvement from a quieter trading month. A restaurant measuring only kilograms cannot determine whether efficiency improved when customer volume changed. And a restaurant mixing preparation waste, spoilage, overproduction and customer leftovers into one figure cannot identify which decision should change.
The better starting point is deliberately unglamorous.
Separate the waste. Weigh it. Categorise it. Connect it to covers and ingredient cost. Identify the cause. Change one process. Measure again.
For restaurant operators across Asia, that sequence turns food waste from something found at the end of the kitchen into management information that can influence purchasing, production, menu decisions and profitability.
What leaves the kitchen deserves almost as much measurement discipline as what is sold from it.